About
This registry exists to help people discover and share collections that are available via Sentinel Hub.
- See all usage examples for collections listed in this registry tagged with open data
- New: Planet Sandbox Data Collections
Search collections (currently 13 matching collections)
You are currently viewing a subset of data tagged with open data.
Add to this registry
If you want to add a collection or example of how to use a collection to this registry, please follow the instructions on the Sentinel Hub Collections GitHub repository.
Unless specifically stated in the applicable collection's documentation, collections available through the Sentinel Hub Collections are not provided and maintained by Sentinel Hub. Collections are provided and maintained by a variety of third parties under a variety of licenses. Please check collection licenses and related documentation to determine if a collection may be used for your application.
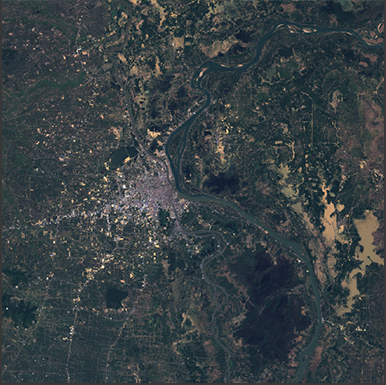
Sentinel-2 L2A 120m Mosaic
agriculturemachine learningmulti spectral imageryopen datasatellite imagerysentinel
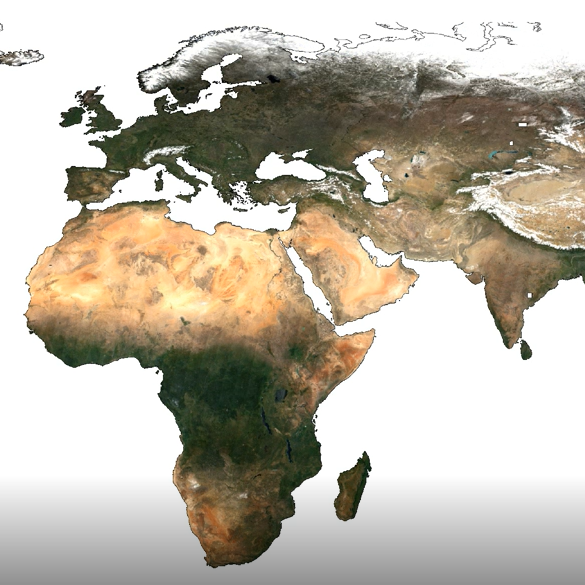
Sentinel-2 L2A 120m mosaic is a derived product, which contains best pixel values for 10-daily periods, modelled by removing the cloudy pixels and then performing interpolation among remaining values. As clouds can be missed and as there are some parts of the world which have lengthy cloudy periods, clouds might be remaining in some parts. The actual modelling script is available here.
Usage examples
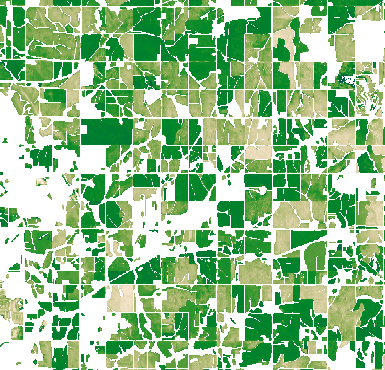
10m Annual Land Use Land Cover (9-class)
derived dataland covermachine learningopen datarastersentinel hub
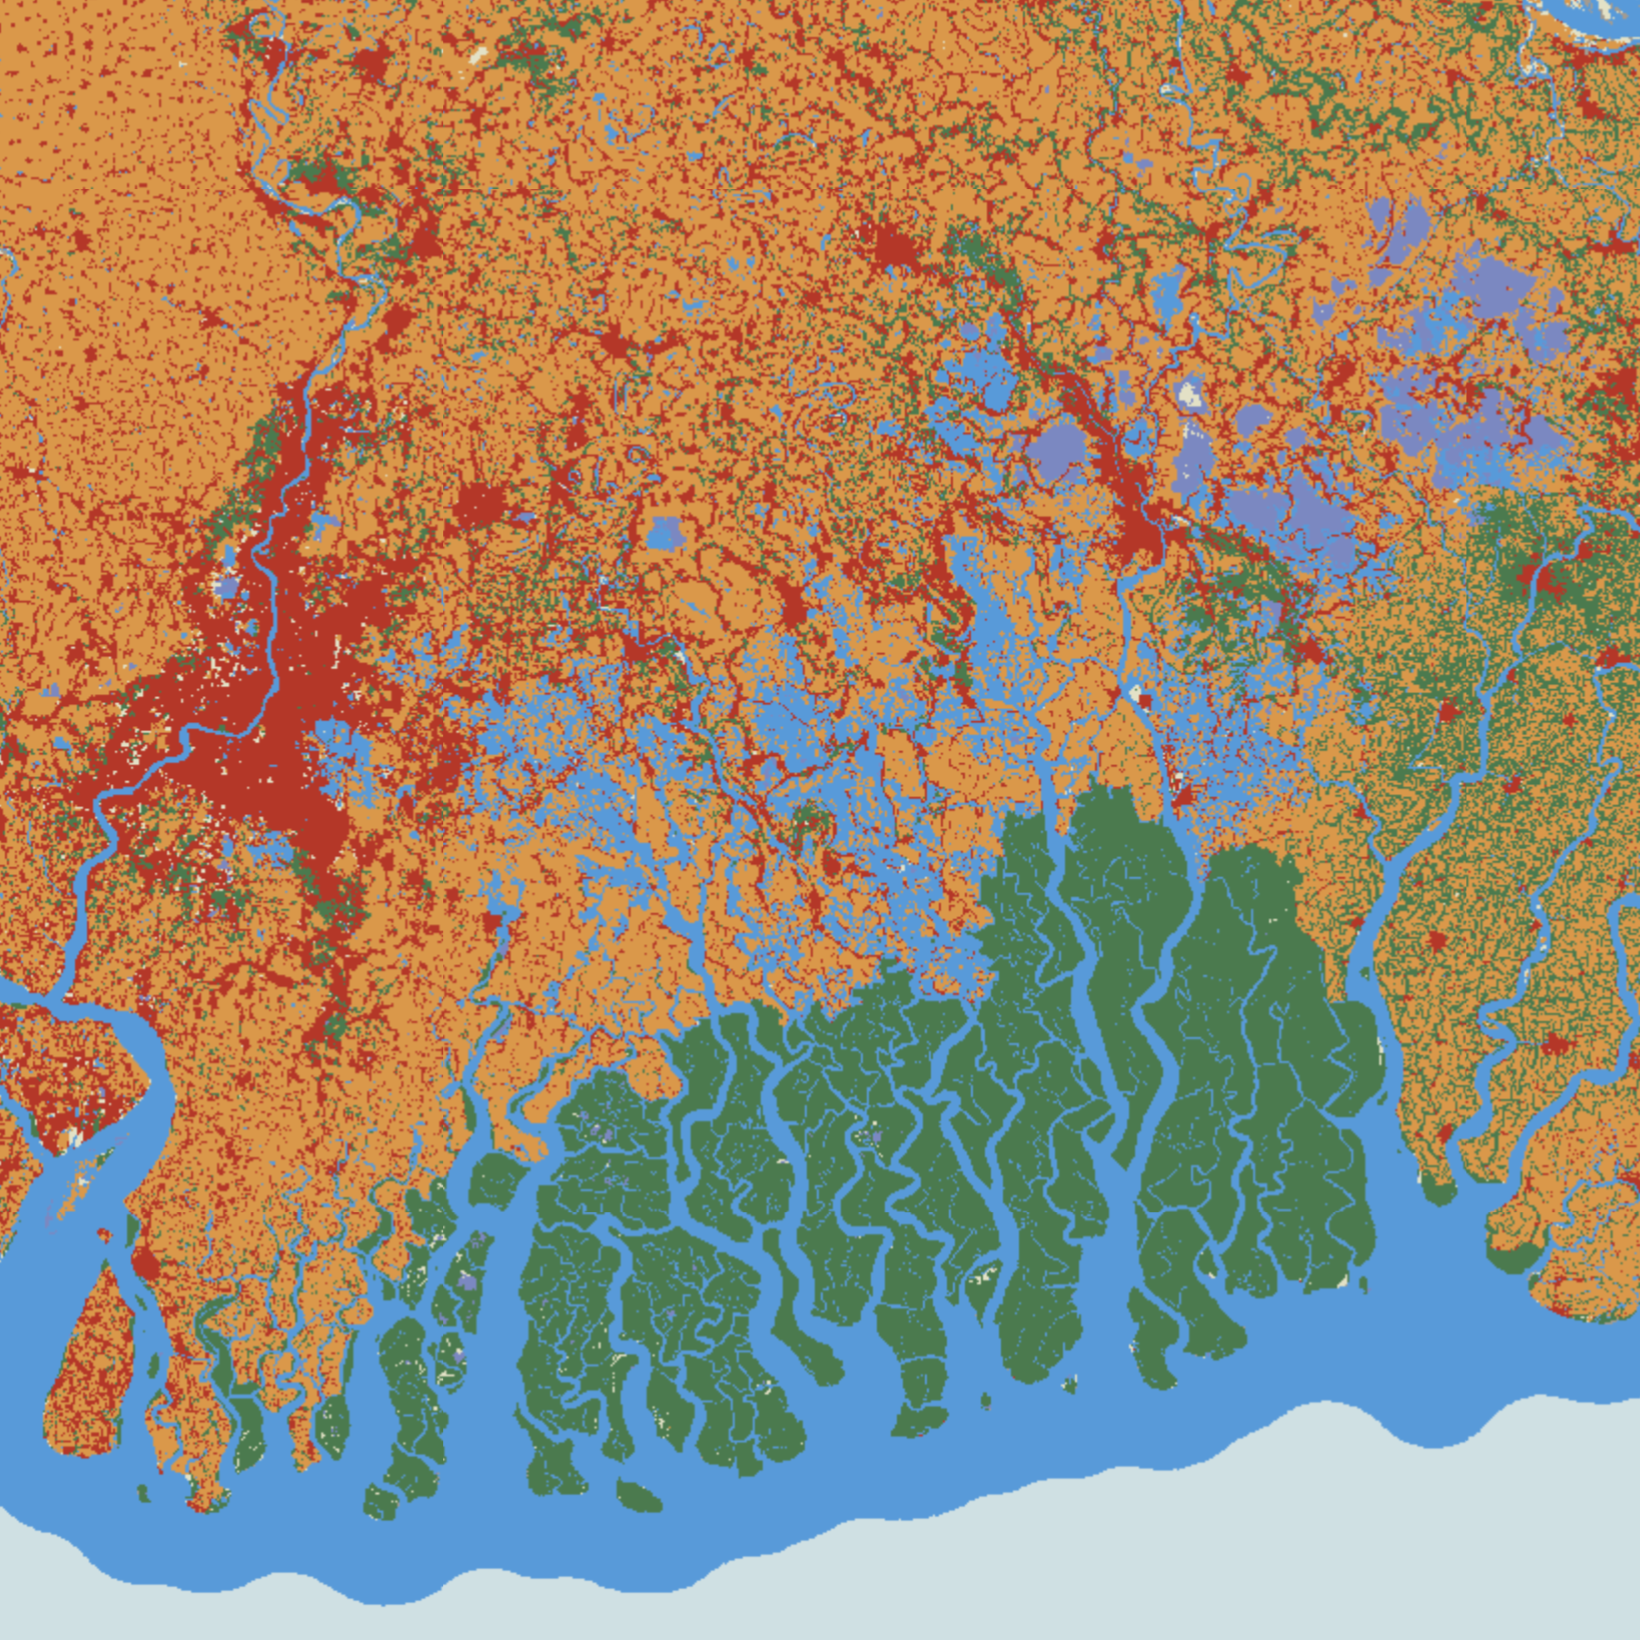
The 10m Annual Land Use Land Cover (LULC) map is produced Impact Observatory, Microsoft, and Esri collaboratively. The data collection is derived from ESA Sentinel-2 imagery at 10m resolution globaly using Impact Ovservatory's state of the art deep learning AI land classification model which is trained by billions of human-labeled image pixels. There are 9 LULC classes generated by the algorithm, including Built, Crops, Trees, Water, Rangeland, Flooded Vegetation, Snow/Ice, Bare Ground, and Clouds.
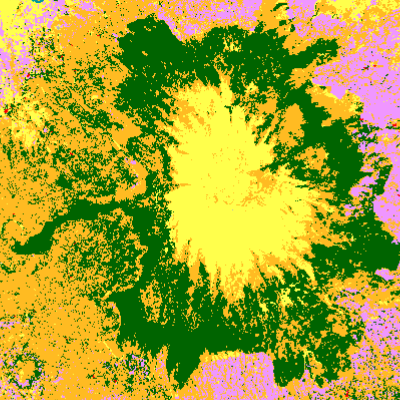
CNES Land Cover Map
derived dataland covermachine learningopen datarastersentinel hubsystematic
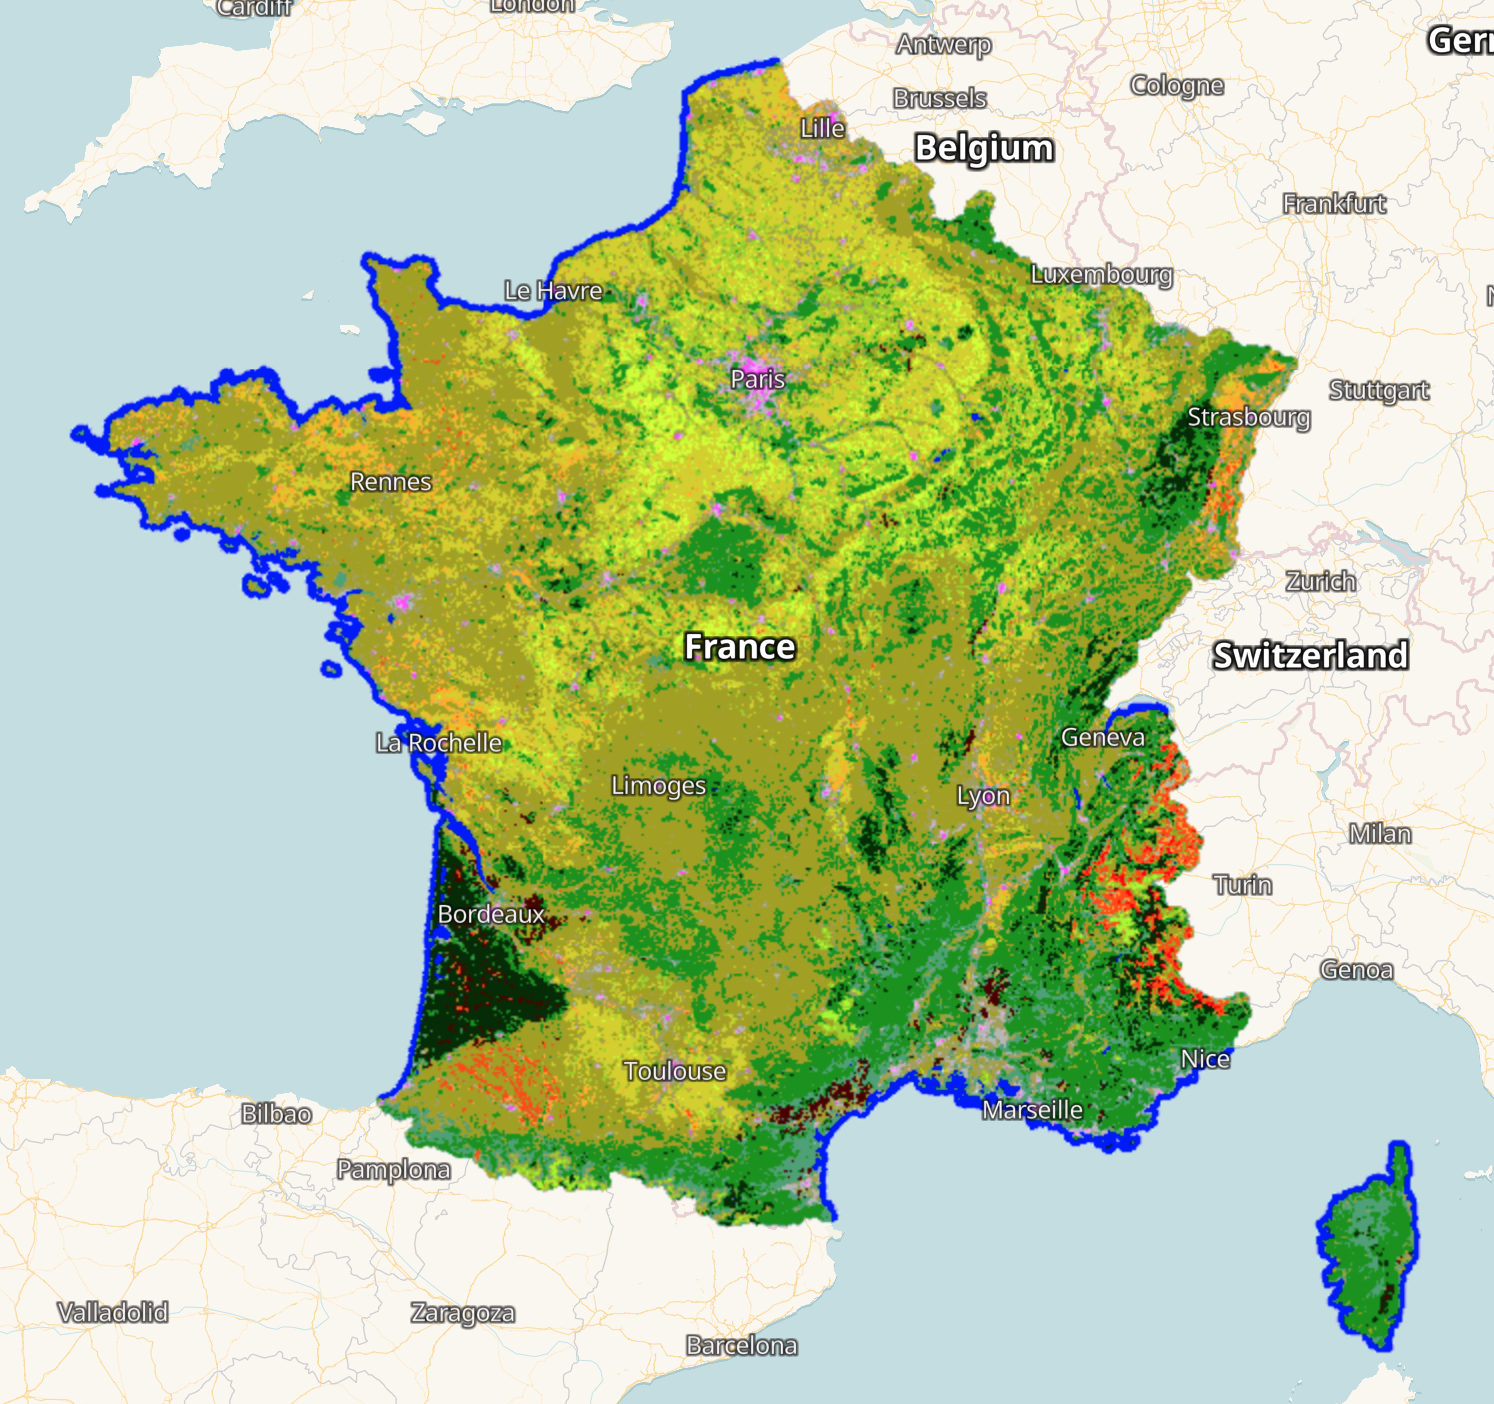
The CNES Land Cover Map (Occupation des Sols, OSO) produces land classification for Metropolitan France at 10 m spatial resolution based on Sentinel-2 L2A data within the Theia Land Cover CES framework. Maps for 2021, 2020, 2019, and 2018 use a 23-categories nomenclature. For earlier maps in 2017 and 2016, a fully compatible 17-classes nomenclature is employed.
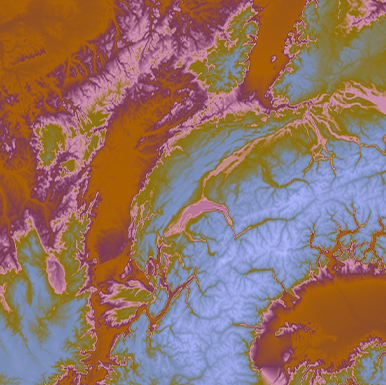
Copernicus DEM
3Dcore collectionDEMelevationopen dataorthorectificationterrain
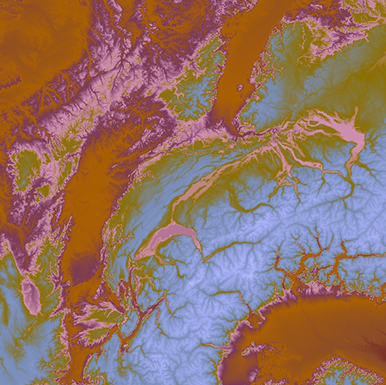
The Copernicus DEM is a Digital Surface Model (DSM) which represents the bare-Earth surface and all above ground natural and built features. It is based on WorldDEM™ DSM that is derived from TanDEM-X and is infilled on a local basis with the following DEMs: ASTER, SRTM90, SRTM30, SRTM30plus, GMTED2010, TerraSAR-X Radargrammetric DEM, ALOS World 3D-30m. Copernicus Programme provides Copernicus DEM in 3 different instances: COP-DEM EEA-10, COP-DEM GLO-30 and COP-DEM GLO-90 where "COP-DEM GLO-90" tiles and most of the "COP-DEM GLO-30 " tiles are available worldwide with fr...
Crop Biomass
agriculturebiomasscommercial dataopen dataplanetary variablessatellite imagery
Crop Biomass provides the ability to track and respond to the highly dynamic nature of biomass in agricultural fields throughout the season. This enables better-informed decisions, input optimization, interventions, and harvest planning. This is a relative measure of biomass, so each pixel value has a value of 0 (low biomass) to 1 (high biomass). The product is provided daily and every day, the user gets a new raster with the data from the most updated direct observation from the day before.
ESA WorldCover
agriculturebiodiversityderived dataland coveropen dataworldcover
The European Space Agency (ESA) WorldCover is a global land cover map with 11 different land cover classes produced at 10m resolution based on combination of both Sentinel-1 and Sentinel-2 data. In areas where Sentinel-2 images are covered by clouds for an extended period of time, Sentinel-1 data then provides complimentary information on the structural characteristics of the observed land cover. Therefore, the combination of Sentinel-1 and Sentinel-2 data makes it possible to update the land cover map almost in real time. WorldCover Map was first produced for 2020 using v100 of the algorit...
Harmonized Landsat Sentinel
brightness temperaturecore collectionlandsatLULC changeLULC mappingnatural resourceopen datasatellite imagerysentinelvegetation monitoring
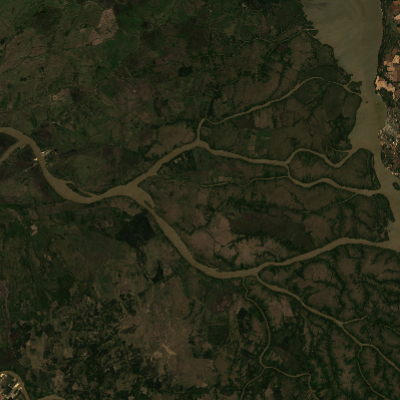
Harmonized Landsat Sentinel is a NASA initiative to produce a Virtual Constellation of surface reflectance (SR) data from the Operational Land Imager (OLI) and Multi-Spectral Instrument (MSI) aboard the Landsat 8-9 and Sentinel-2 remote sensing satellites, respectively. The combined measurement enables global observations of the land every 2–3 days. Input products are Landsat 8-9 Collection 2 Level 1 top-of-atmosphere reflectance and Sentinel-2 L1C top-of-atmosphere reflectance, which NASA radiometrically harmonizes to the maximum extent, resamples to common 30-meter resolution, and grids usin...
Landsat 1-5 MSS L1
core collectionlandsatLULC changeLULC mappingnatural resourceopen datasatellite imageryvegetation monitoring
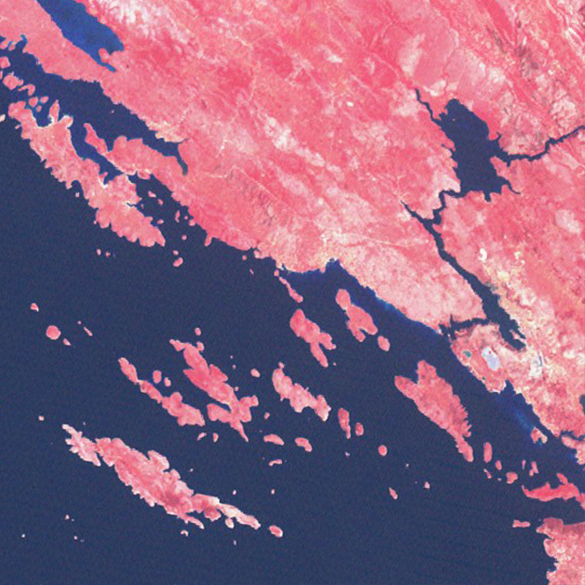
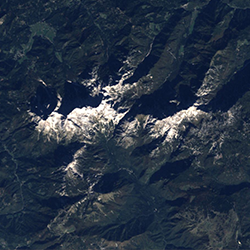
The Landsat Multispectral Scanner System (MSS) sensors were carried onboard Landsats 1 to 5. It provides 4 spectral bands. See USGS EROS Archive for more information. MSS Level-1 data provides Top of Atmosphere Reflectance products for the period from July 1972 to October 1992 and from June 2012 to January 2013.
Landsat 4-5 TM L1
core collectionlandsatLULC changeLULC mappingnatural resourceopen datasatellite imagerysurface temperaturevegetation monitoring
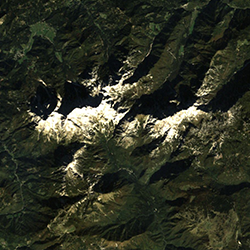
The Landsat Thematic Mapper (TM) sensor was carried onboard Landsats 4 and 5. TM collected data in 7 spectral bands; from the blue, green, red, near-infrared, mid-infrared (2) and thermal infrared portions of the electromagnetic spectrum. Visit USGS EROS Archive - Landsat Archives - Landsat 4-5 Thematic Mapper Collection 2 Level-1 Data webpage for more information.
Landsat 4-5 TM L2
core collectionlandsatLULC changeLULC mappingnatural resourceopen datasatellite imagerysurface temperaturevegetation monitoring
The Landsat Thematic Mapper (TM) sensor was carried onboard Landsats 4 and 5. TM collected data in 7 spectral bands; from the blue, green, red, near-infrared, mid-infrared(2) and thermal infrared portions of the electromagnetic spectrum. L2 data include Surface Reflectance and Surface Temperature scene-based products. Visit USGS EROS Archive - Landsat Archives - Landsat 4-5 TM Collection 2 Level-2 Science Products for more information.
Landsat 7 ETM+ L1
brightness temperaturecore collectionlandsatLULC changeLULC mappingnatural resourceopen datasatellite imageryvegetation monitoring
The Landsat 7 Enhanced Thematic Mapper (ETM+) sensor is carried onboard Landsat 7. ETM+ provides 7 spectral bands and 1 thermal band. See USGS EROS Archive for more information. Landsat 7 Level-1 data provides Top of Atmosphere Reflectance and Top of the Atmosphere Brightness Temperature products. Level 1 data are available since April 1999. All scenes collected since May 30, 2003 have data gaps due to the Scan Line Corrector (SLC) failure.
Landsat 7 ETM+ L2
core collectionlandsatLULC changeLULC mappingnatural resourceopen datasatellite imagerysurface temperaturevegetation monitoring
The Landsat 7 Enhanced Thematic Mapper (ETM+) sensor is carried onboard Landsat 7. ETM+ provides 7 spectral bands and 1 thermal band. See USGS EROS Archive for more information. Landsat 7 level-2 data provides atmospherically corrected Surface Reflectance and Surface Brightness Temperature products. Level-2 data are available since April 1999.
Landsat 8-9 L1
core collectionlandsatLULC changeLULC mappingnatural resourceopen datasatellite imagerysurface temperaturevegetation monitoring
Landsat 8-9 Level 1 collection includes both Landsat 8 and the most recently launched Landsat 9 satellites (provided by NASA/USGS), both carrying the Operational Land Imager (OLI) and the Thermal Infrared Sensor (TIRS) instruments, with 9 optical and 2 thermal bands. These two sensors provide seasonal coverage of the global landmass. Landsat 8-9 Level 1 data from the most recently released collection 2, provides Top of Atmosphere Reflectance and Top of the Atmosphere Brightness Temperature products. Level 1 data are available since February 2013 for Landsat 8 and since January 2022 for La...
Landsat 8-9 L2
core collectionlandsatLULC changeLULC mappingnatural resourceopen datasatellite imagerysurface temperaturevegetation monitoring
Landsat 8-9 Level 2 collection includes both Landsat 8 and the most recently launched Landsat 9 satellites (provided by NASA/USGS), both carrying the Operational Land Imager (OLI) and the Thermal Infrared Sensor (TIRS) instruments, with 9 optical and 2 thermal bands. These two sensors provide seasonal coverage of the global landmass. Landsat 8-9 Level 2 data from the most recently released collection 2, provides atmospherically corrected Surface Reflectance and Surface Brightness Temperature products generated from Collection 2 Level-1 scenes that have been processed to Tier 1 or Tier 2. C...
MODIS MCD43A4.006
agriculturecore collectiondisaster responsenatural resourceopen datasatellite imagery
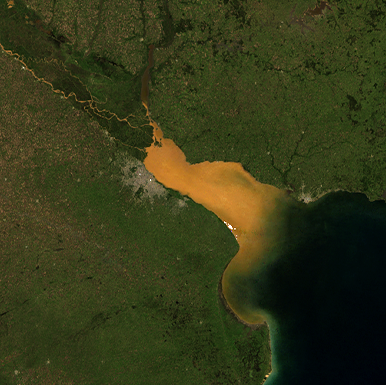
MODIS (Moderate Resolution Imaging Spectroradiometer) is the main instrument operating on both NASA's Terra and Aqua satellites. It acquires images of the earth in 36 bands within the visible and the infrared regions of the spectrum at low to medium spatial resolutions. MODIS is designed to provide atleast daily observations of land, oceans and lower atmosphere that contribute to local or global scale land or water applications. There are several products derived from MODIS which include land, atmosphere, cryospehere and ocean products. MCD43A4 Nadir BRDF-Adjusted Reflectance (NBAR) produ...
Mapzen DEM
3Dcore collectionDEMelevationopen dataorthorectificationterrain
Mapzen DEM is based on Mapzen's terrain tiles that provide global DEM and bathymetry data. Mapzen terrain tiles is a composite of elevation data of varying resolutions from multiple open data sources including Details →
Sentinel-1 GRD
core collectiondisaster responseland monitoringmaritime monitoringopen dataSARsatellite imagerysentinel
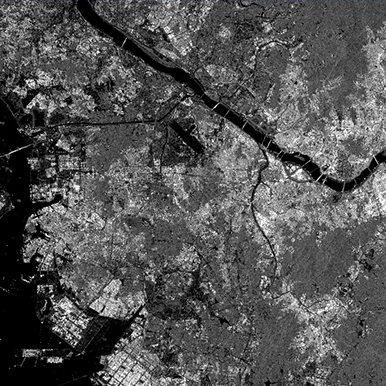
The Sentinel - 1 radar imaging mission is composed of a constellation of two polar-orbiting satellites providing continous all-weather, day and night imagery for Land and Maritime Monitoring. C-band synthentic aperture radar imaging has the advantage of operating at wavelenghts that are not obstructed by clouds or lack of illumination and therefore can acquire data during day or night under all weather conditions. With 6 days repeat cycle on the entire world and daily acquistions of sea ice zones and Europe's major shipping routes, Sentinel-1 ensures reliable data availability to support...
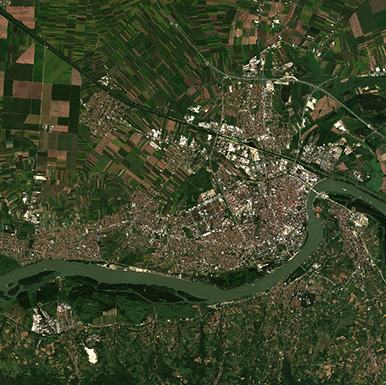
Sentinel-2 L1C
agriculturecore collectiondisaster responsemulti spectral imagerynatural resourceopen datasatellite imagerysentinel
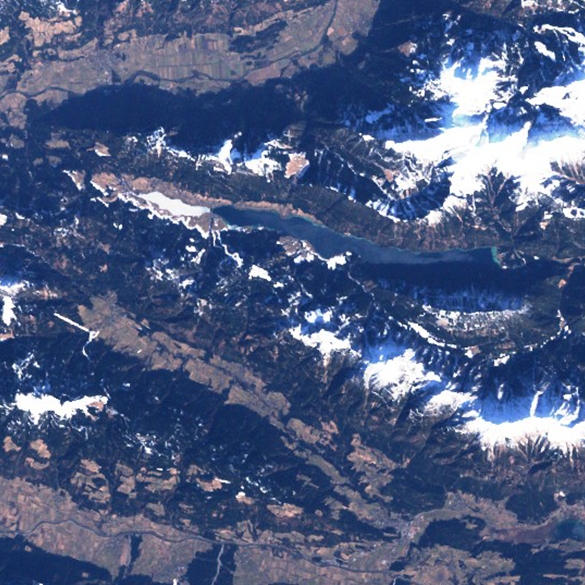
The Sentinel-2 mission is a land monitoring constellation of two satellites that provide high resolution optical imagery and provide continuity for the current SPOT and Landsat missions. The mission provides a global coverage of the Earth's land surface every 5 days, making the data of great use in on-going studies. L1C data are available from June 2015 globally. L1C data provide Top of the atmosphere (TOA) reflectance.
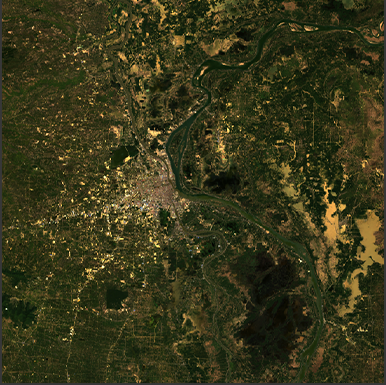
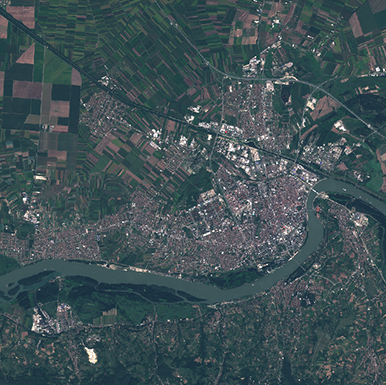
Sentinel-2 L2A
agriculturecore collectiondisaster responsemulti spectral imagerynatural resourceopen datasatellite imagerysentinel
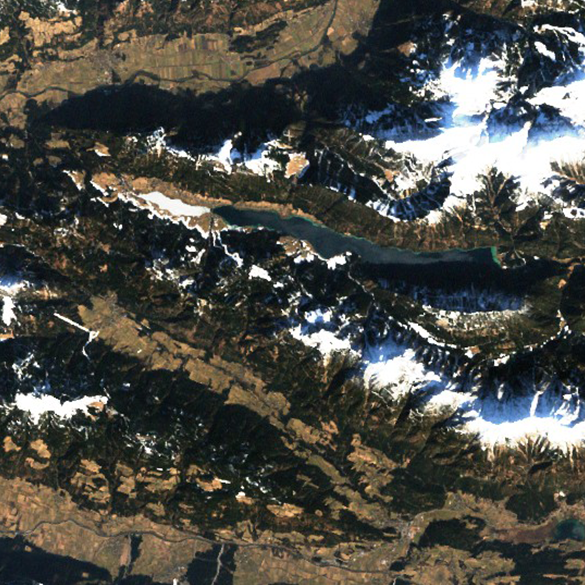
The Sentinel-2 mission is a land monitoring constellation of two satellites that provide high resolution optical imagery and provide continuity for the current SPOT and Landsat missions. The mission provides a global coverage of the Earth's land surface every 5 days, making the data of great use in on-going studies. L2A data are available from November 2016 over Europe region and globally since January 2017. L2A data provide Bottom of the atmosphere (BOA) reflectance.