Global Surface Water
Short description
The Global Surface Water dataset was developed by the European Commission's Joint Research Centre (JRC) within the framework of the Copernicus Programme. It is derived from Landsat 5, 7 and 8 imagery and shows various aspects of the spatio-temporal distribution of surface water between 1984 and 2021 (with annual revisions) at the global scale in six different layers. Surface water is considered as any uncovered stretch of water (fresh and salt water areas) greater than 30m² visible from space, including natural and artificial water bodies.Please check the FAQ on the official Global Surface Water website for more details. Detailed information on the processing methodology for the included layers can be found in the Data Users Guide and Pekel et al. (2016) [1] as the associated scientific publication.
Band information
The Global Surface Water dataset contains six layers that are listed in the table below:Table 1: Layer Overview
| Name | Data type | Description |
|---|---|---|
| occurrence | unsigned int8 | The occurrence value expressed as a percentage |
| change | unsigned int8 | The normalised difference in the mean occurrence value between the two epochs for homologous months epoch1-epoch2 /epoch1+epoch2 |
| seasonality | unsigned int8 | The number of months that water was present from January to December in the year of review (2019, 2020 or 2021) |
| recurrence | unsigned int8 | The frequency with which water returns from year to year expressed as a percentage |
| transitions | unsigned int8 | The type of transition between the first and last year |
| extent | unsigned int8 | A simple flag indicating if water was detected or not |
Occurrence
The water Occurrence layer shows the (intra- and inter-annual) variations of surface water presence in the time range between March 1984 and December 2021. Permanent water areas with 100% occurrence over the 38 years are shown in blue, while lighter shades of pink and purple indicate lower degrees of water presence, according to the official layer symbology (Table 2).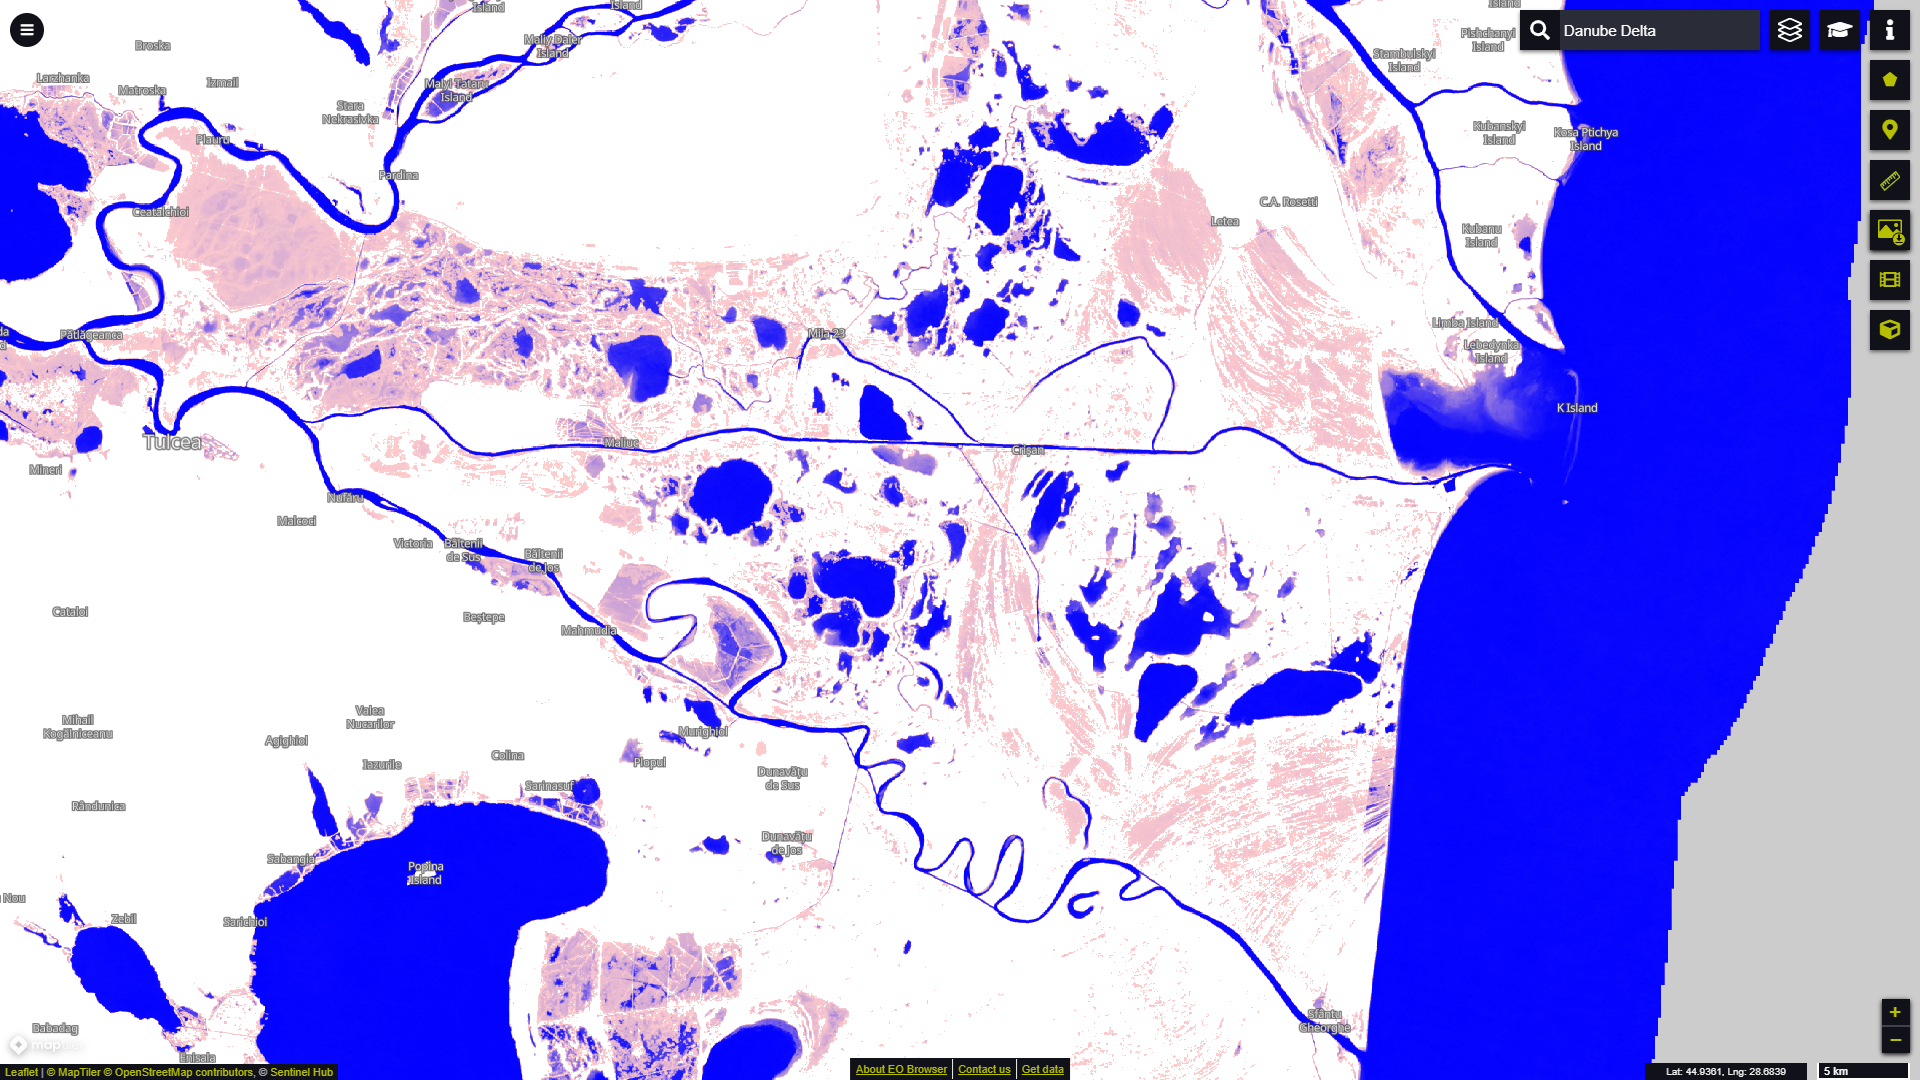
Occurrence layer visualisation in EO Browser for the Danube Delta in Romania.
Table 2: Occurrence Symbology
| Value | Symbol | Colour | Label |
|---|---|---|---|
| 0 | 0xffffff | Not water | |
| 1 | 0xffcccc | 1% occurrence | |
| 100 | 0x0000ff | 100% occurrence | |
| 255 | 0xcccccc | No data |
A visualisation script for the Occurrence layer can be found in our custom scripts repository.
Occurrence Change Intensity
The Occurrence Change Intensity layer visualises changes in water occurrence between two different epochs, the first ranging from March 1984 to December 1999, and the other covering the period from January 2000 to December 2021. According to the official layer symbology, the increase of water occurrence is visualised in different shades of green, no change is shown in black and decrease is shown in shades of red (Table 3).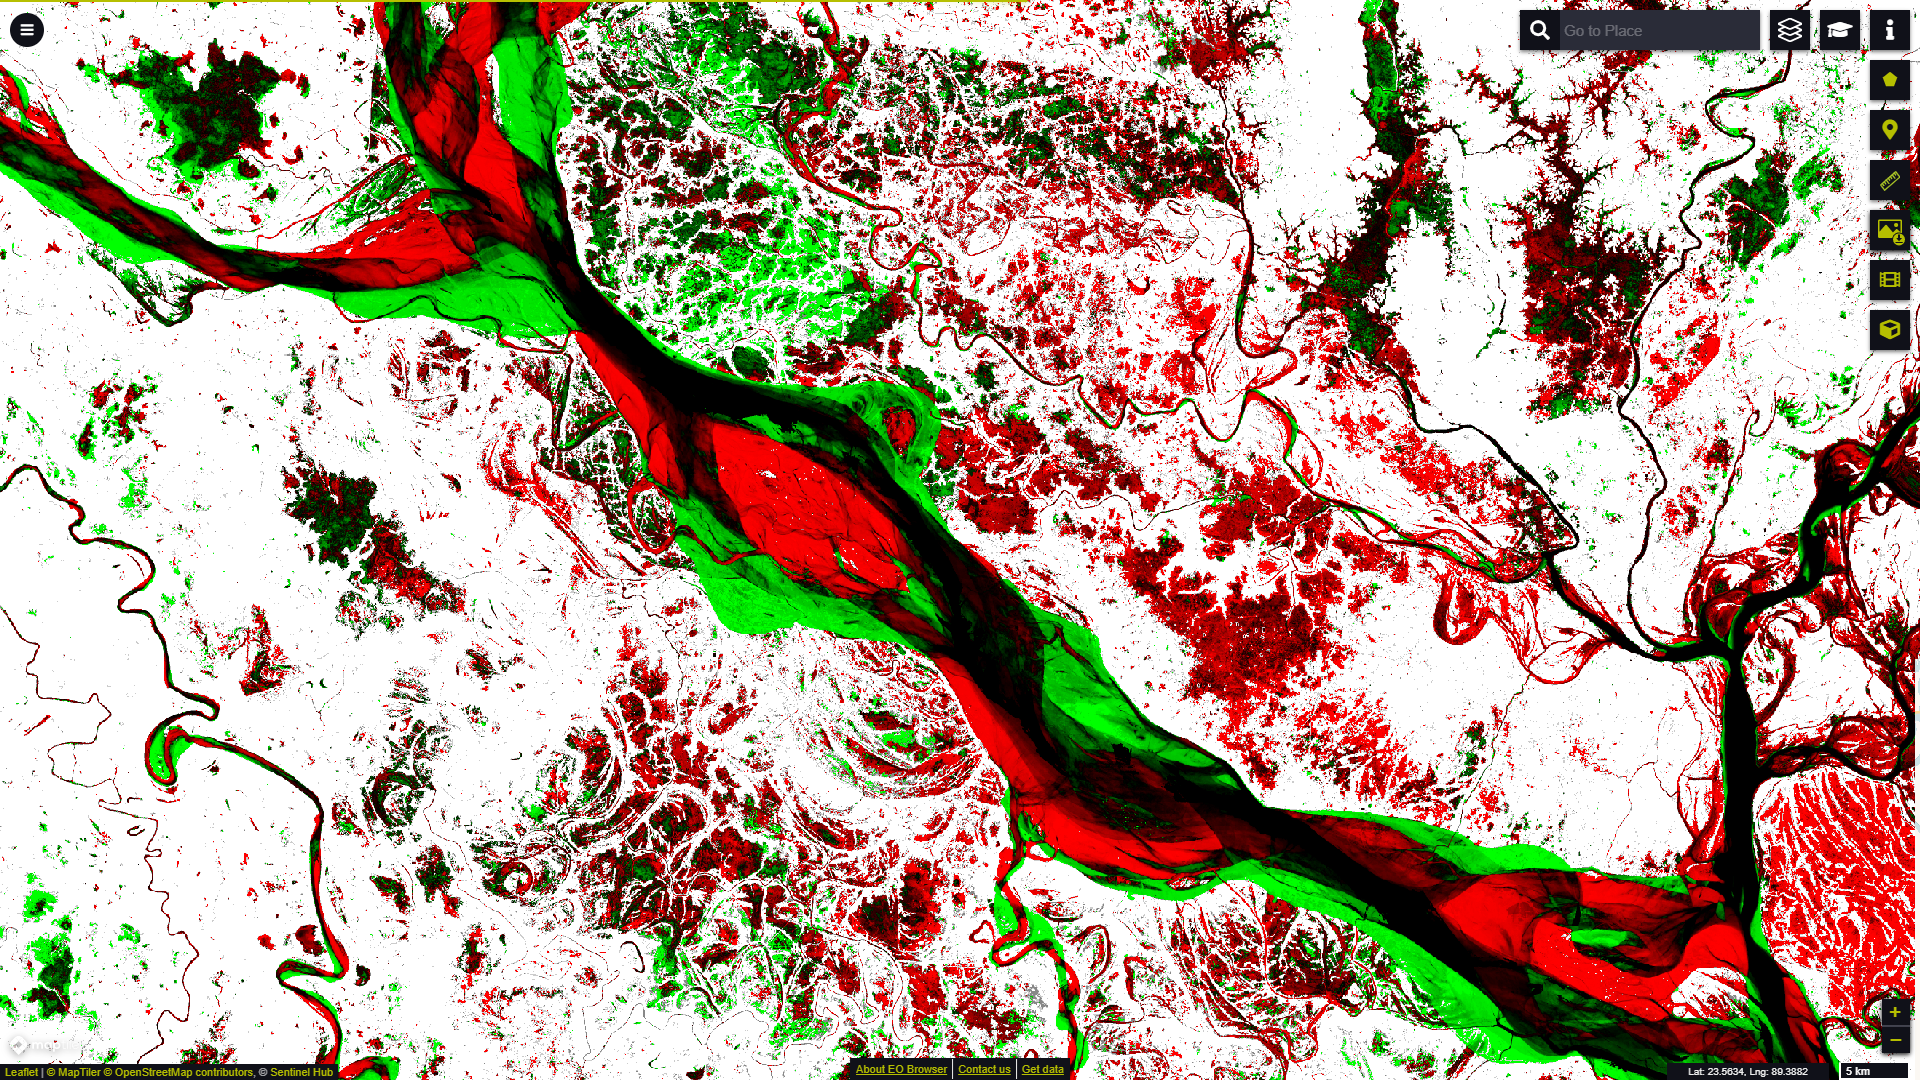
Occurrence Change Intensity layer visualisation in EO Browser for a section of the Padma River, the main distributary of the Ganges, in Bangladesh.
Table 3: Occurrence Change Intensity Symbology
| Value | Symbol | Colour | Label |
|---|---|---|---|
| 0 | 0xff0000 | -100% loss of occurrence | |
| 100 | 0x000000 | No change | |
| 200 | 0x00ff00 | 100% increase in occurrence | |
| 253 | 0xffffff | Not water | |
| 254 | 0x888888 | Unable to calculate a value due to no homologous months | |
| 255 | 0xcccccc | No data |
A visualisation script for the Occurence Change Intensity layer can be found in our custom scripts repository.
Seasonality
The Seasonality layer provides information on the intra-annual distribution of surface water in the particular review year. According to the number of months with water cover, the discrete colour map shows areas with permanent water bodies in dark blue and seasonal surface water in gradually lighter shades of blue (Table 4).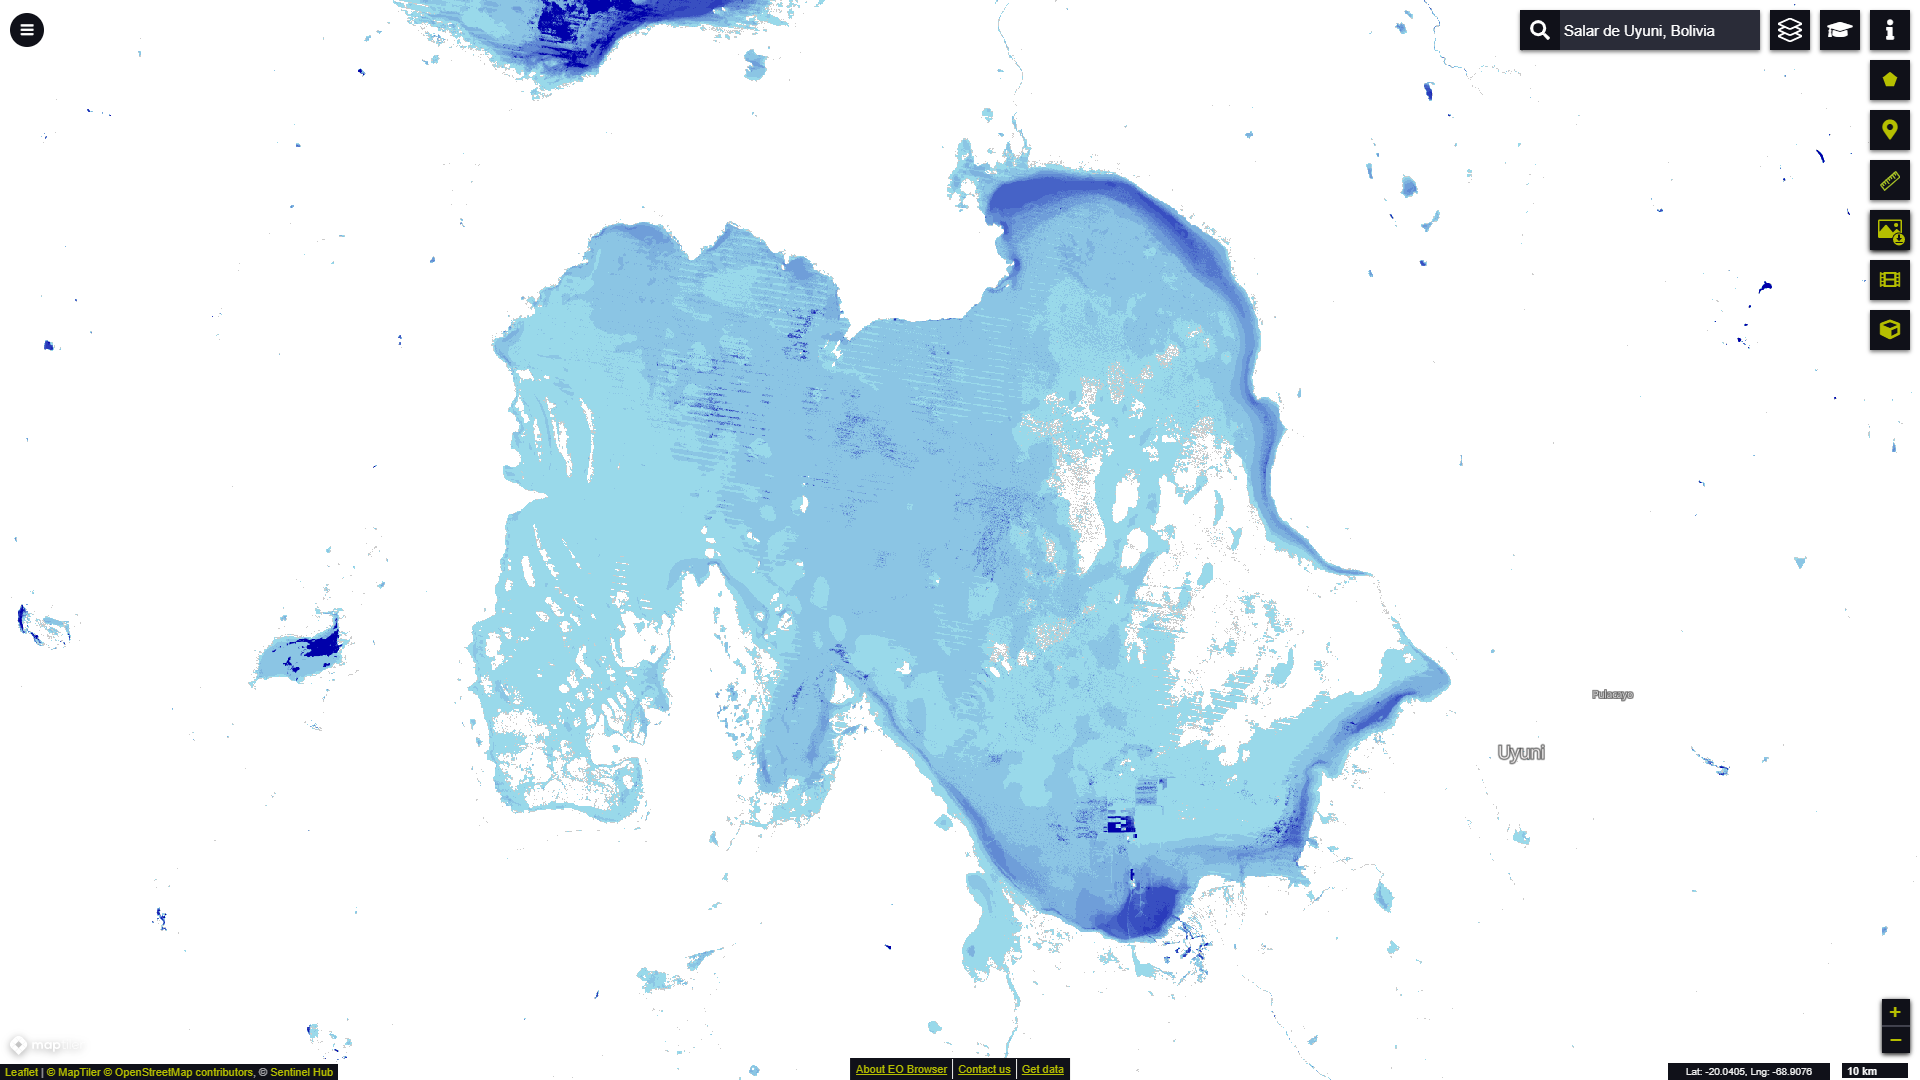
Eo Browser visualisation of surface water Seasonality in the world's largest salt flat Salar de Uyuni in southwest Bolivia.
Table 4: Seasonality Symbology
| Value | Symbol | Colour | Label |
|---|---|---|---|
| 0 | 0xffffff | Not water | |
| 1 | 0x99d9ea | 1 month of water | |
| 12 | 0x0000aa | 12 months of water (permanent water) | |
| 255 | 0xcccccc | No data |
A visualisation script for the Seasonality layer can be found in our custom scripts repository.
Recurrence
The Recurrence layer captures the degree of interannual variability in surface water presence. It shows how frequently water returned to a particular location between years in a defined water period within the period from 1984 to 2021. The water period is defined individually for each pixel, ranging from the first month with an observation of surface water to the last month with surface water present throughout the 38-year time range. Areas with seasonal or permanent water presence are visualised in blue, while irregularly flooded areas are shown in orange (Table 5).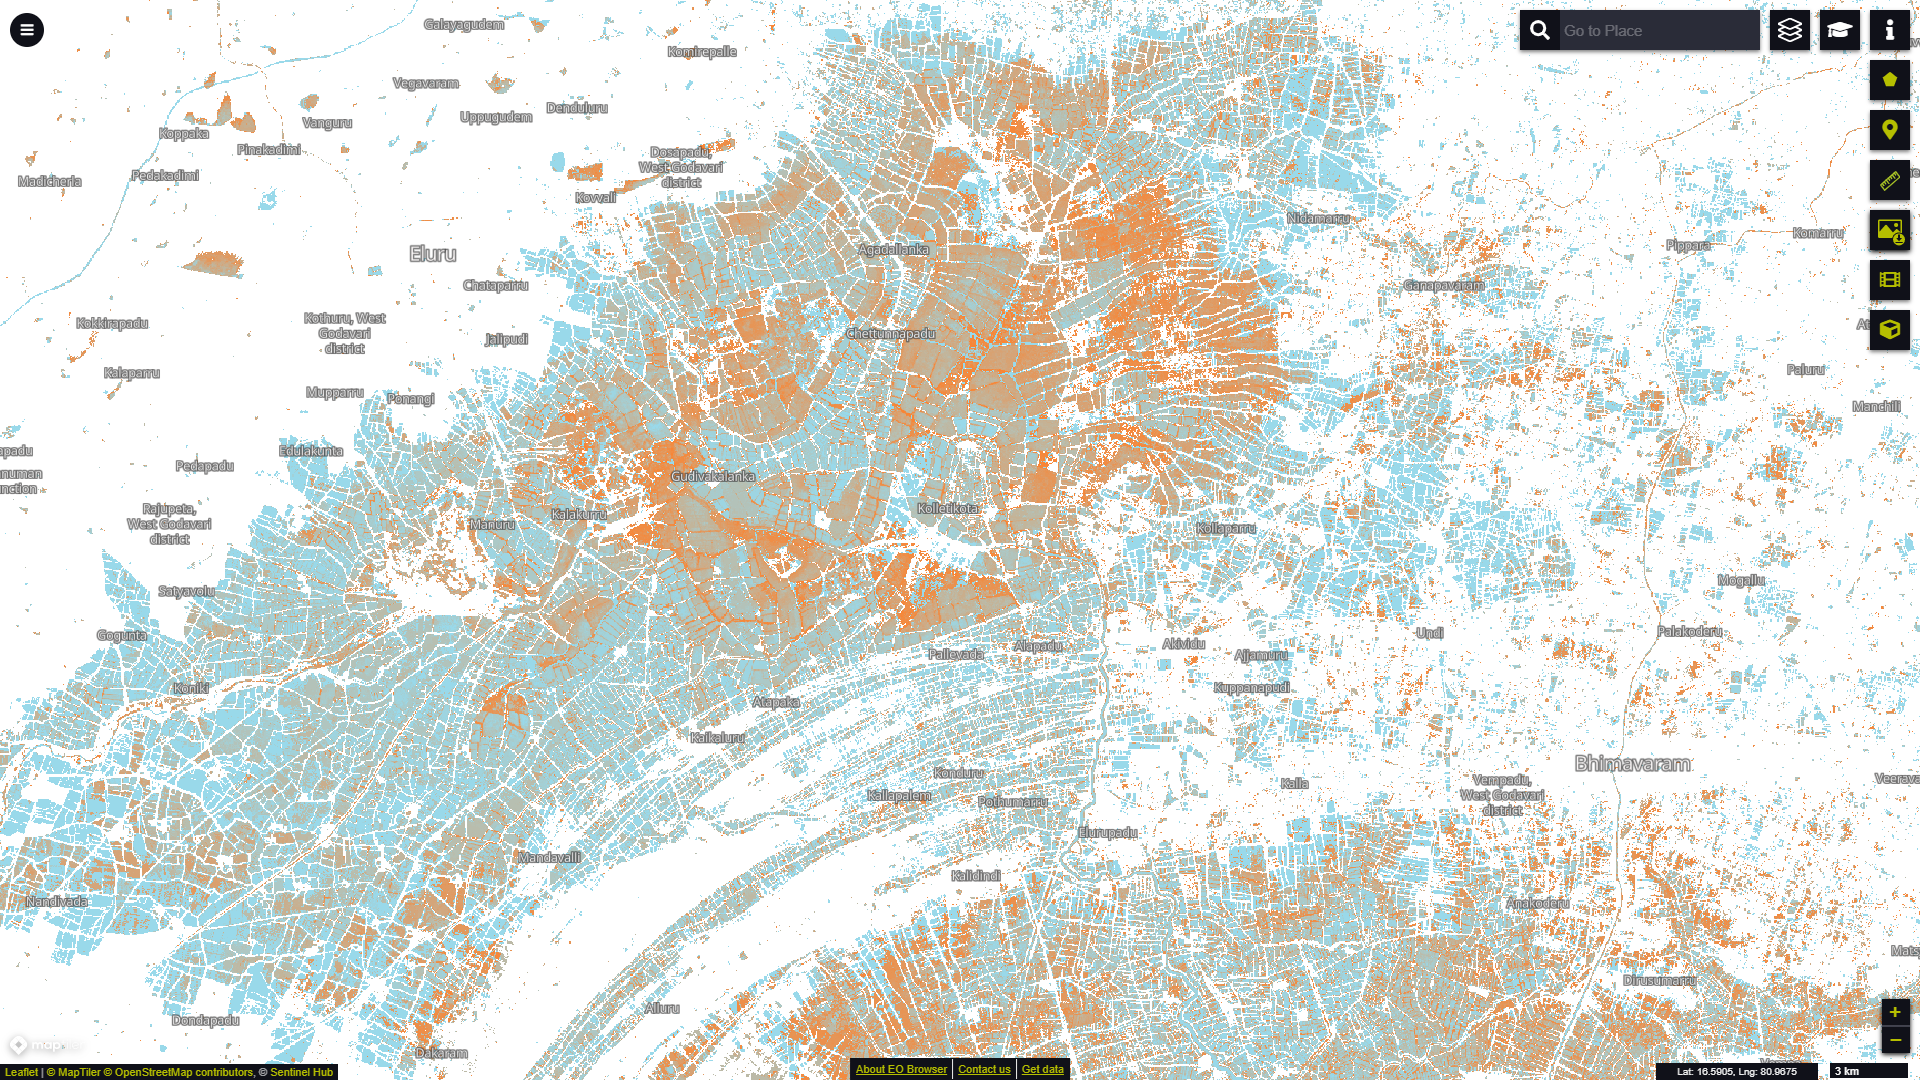
Recurrence layer visualisation in EO Browser showing Paddy fields near the city of Eluru in West Godavari, India.
Table 5: Recurrence Symbology
| Value | Symbol | Colour | Label |
|---|---|---|---|
| 0 | 0xffffff | Not water | |
| 1 | 0xff7f27 | 1% recurrence | |
| 100 | 0x99d9ea | 100% recurrence | |
| 255 | 0xcccccc | No data |
A visualisation script for the Recurrence layer can be found in our custom scripts repository.
Transitions
The Transitions layer is derived from a seasonality comparison between the first and last year in the 38-year time period and visualises changes in the three surface water classes of not water, seasonal, and permanent water. A discrete colour map for the class transitions is provided in Table 6.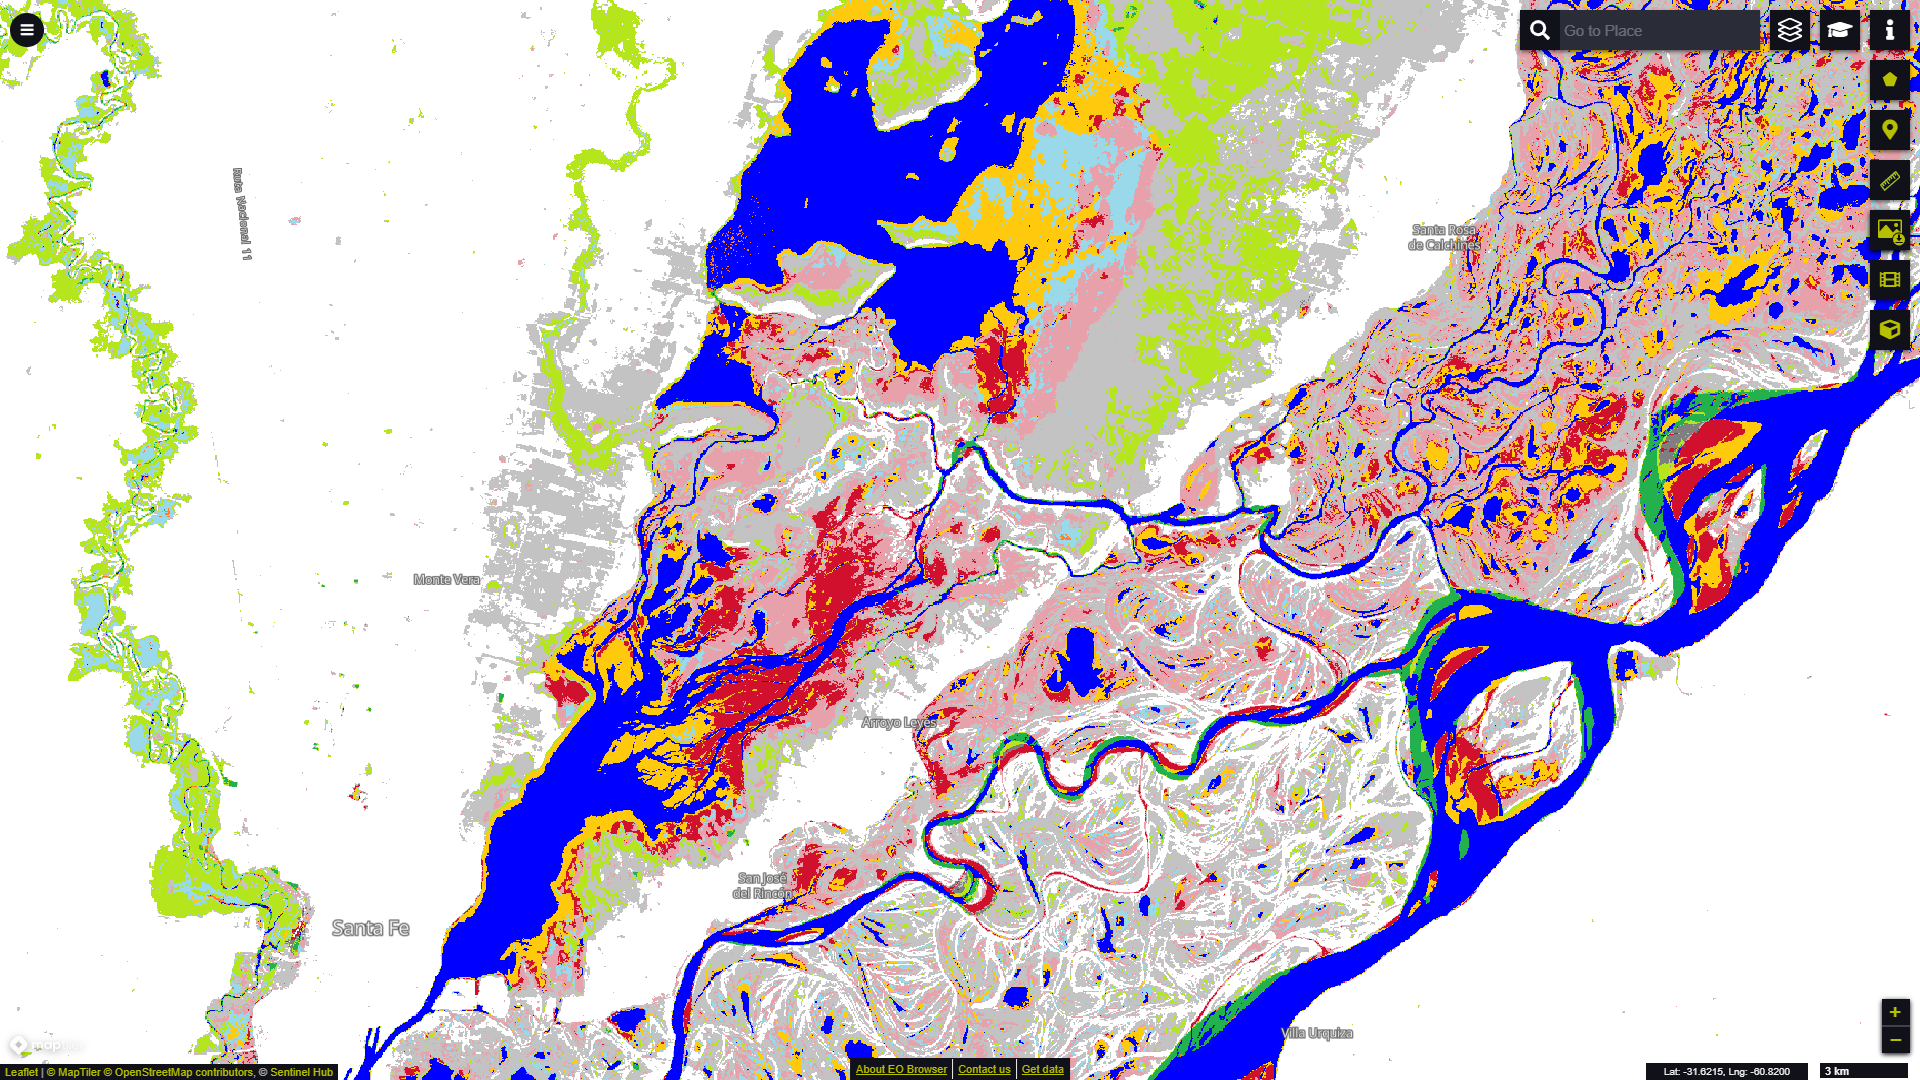
EO Browser visualisation of the Transitions layer showing the Paraná River near santa Fe, Argentina.
Table 6: Transitions Symbology
| Value | Symbol | Colour | Label |
|---|---|---|---|
| 0 | 0xffffff | Not water | |
| 1 | 0x0000ff | Permanent | |
| 2 | 0x22b14c | New permanent | |
| 3 | 0xd1102d | Lost permanent | |
| 4 | 0x99d9ea | Seasonal | |
| 5 | 0xb5e61d | New seasonal | |
| 6 | 0xe6a1aa | Lost seasonal | |
| 7 | 0xff7f27 | Seasonal to permanent | |
| 8 | 0xffc90e | Permanent to seasonal | |
| 9 | 0x7f7f7f | Ephemeral permanent | |
| 10 | 0xc3c3c3 | Ephemeral seasonal | |
| 255 | 0xcccccc | No data |
A visualisation script for the Transitions layer can be found in our custom scripts repository.
Extent
The maximum water Extent layer combines all other layers by visualising all locations for which water presence has ever been detected over the 38-year period.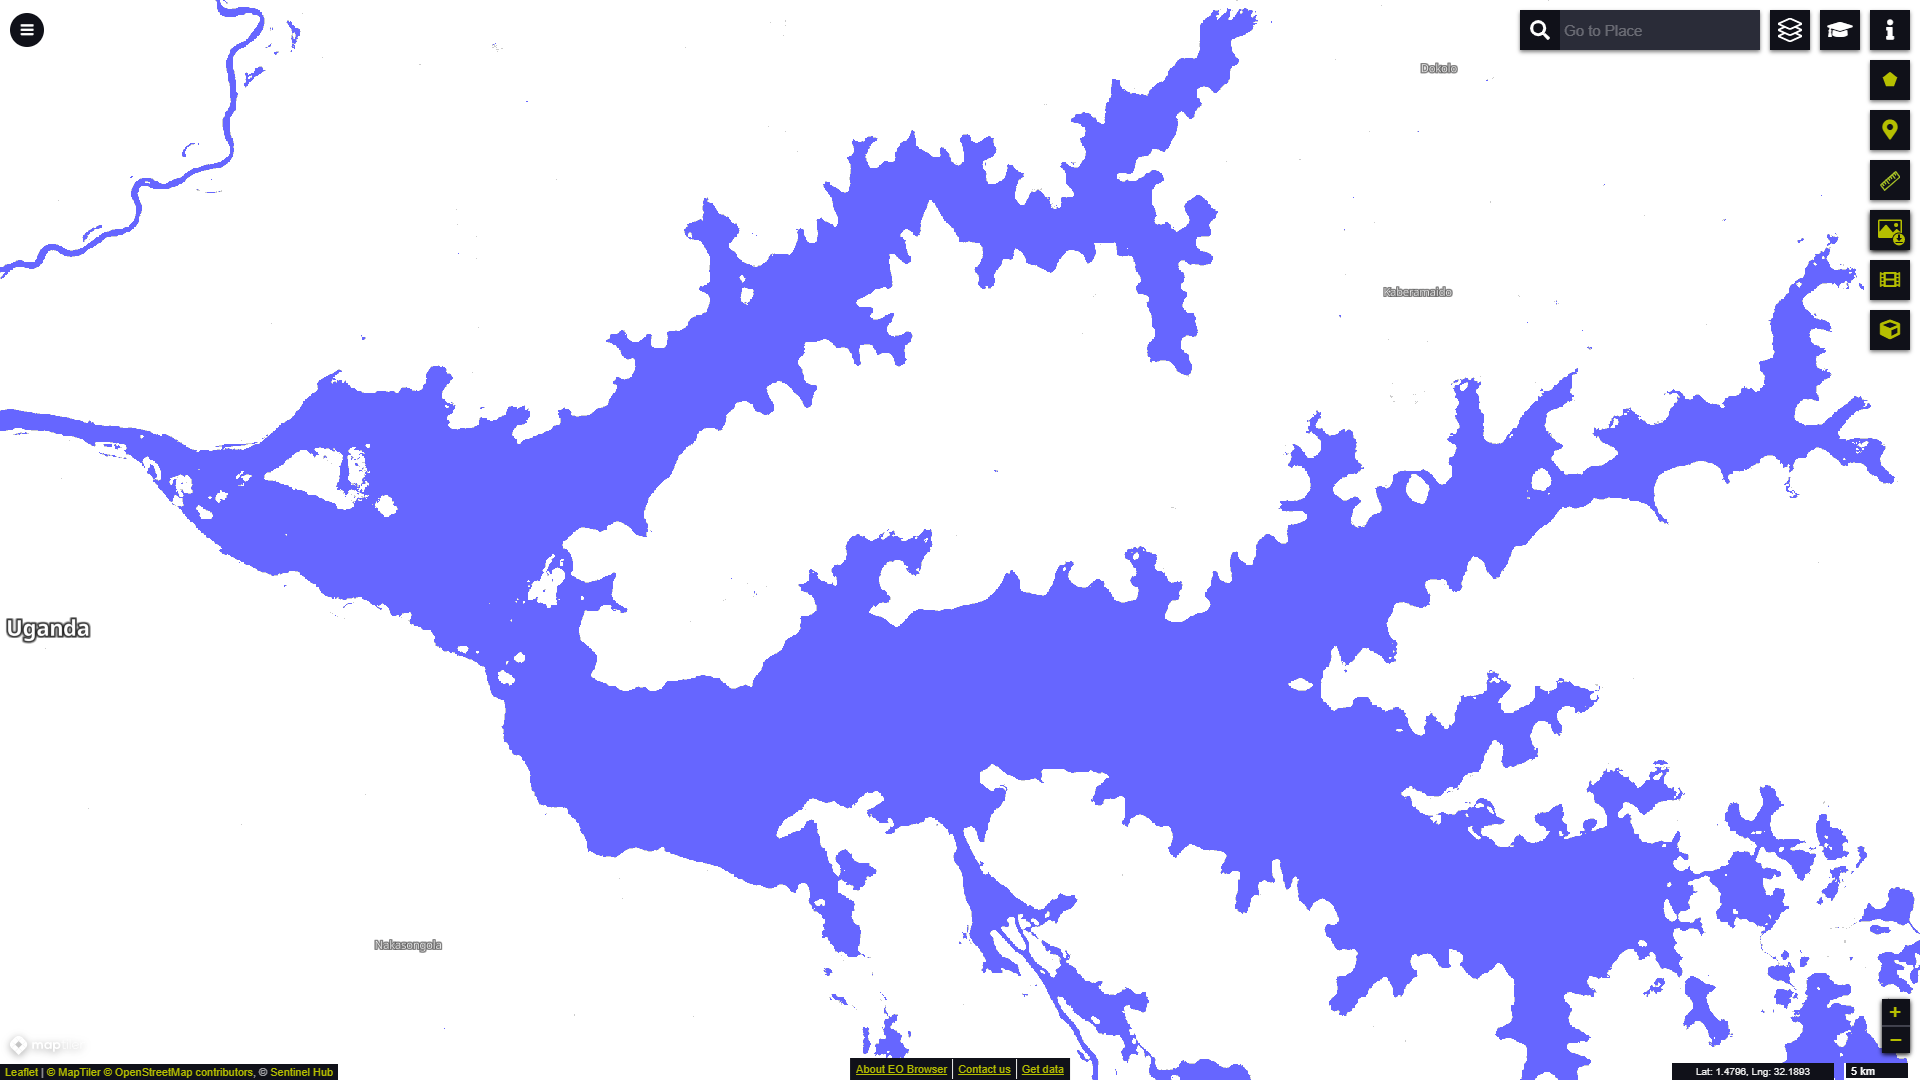
Extent layer visualisation in EO Browser capturing the maximum water extent for Lake Kyoga, Uganda.
Table 7: Extent Symbology
| Value | Symbol | Colour | Label |
|---|---|---|---|
| 0 | 0xffffff | Not water | |
| 1 | 0x6666ff | Water detected | |
| 255 | 0xcccccc | No data |
A visualisation script for the Extent layer can be found in our custom scripts repository.